Hello world!
=4
Foreword
Goals
The goal of this training course is to give an overview of the OTB remote sensing image processing library and to apply it to real case problems using OTB applications, which make the use of remote sensing data easy.
The course allows to acquire the ability to design and create remote sensing image processing chains using OTB applications, including:
- Feature extraction
- Calibration
- Classification
- Segmentation
- Synthetic Aperture Radar processing
Training kit
Data package
- Data used in all exercises (sub-folder for each exercise)
- Data folder is specified at the beginning of each exercise
- Download from:
www.orfeo-toolbox.org/packages/WorkshopData/WorkshopData.zip
Guides
- Training guide
- Slides
- Installation guide
- Evaluation survey
- Solutions (at the end of the training session)
Software documentation
- Software Guide
C++ API (with algorithms definition)
www.orfeo-toolbox.org/SoftwareGuide/index.html- CookBook
Guide for non developers (API of applications)
www.orfeo-toolbox.org/CookBook/- QGIS User Guide
docs.qgis.org/2.14/en/docs/user_manual
Datasets
- Sentinel-2
- concatenation of several dates, cloud free (gap-filled) with ground truth (reference data) in ESRI Shapefile format (classification exercise)
- Pléiades
- PHR Bundle PRIMARY Level 1A from the CNES Thematic Commissioning phase over OSR MiPy (Toulouse, France) acquired in November 2013 (©CNES (2013), distribution Airbus DS/ Spot Image),
- Sentinel-1
- SLC product (complex) SM (strip Map, 5m ground resolution), polarimetric (HH and HV) over the South of the Constance lake (Germany).
Software requirements
To complete exercises, you need to install the following tools:
- Orfeo ToolBox
 5.4 with applications
 - Monteverdi 3.2
- QGIS 2.8
To install the Orfeo ToolBox and Monteverdi, follow the instructions in the ORFEO ToolBox cookbook.
To install QGIS follow the instructions on the QGIS website.
Datasets
Datasets used during the training courses:
- Sentinel-2
- 9 dates concatenated, cloud-free (gap-filled) with reference data in ESRI Shapefile provided by CESBIO (for the classification exercise),
- Pléiades
- Bundle PRIMARY Level 1A from CNES Thematic Comissionning Phase over OSR MiPy (South West of Toulouse, France), 2013 (©CNES (2013), distribution Airbus DS/ Spot Image),
- Sentinel-1
- Single Look Complex (SLC) product - Strip Map (80 km swath, 5x5 m res), dual-polarization (HH and HV) near Constance lake (Germany).
For more information on these satellites:
- Sentinel-2
- level 2A available on THEIA website.
- Pléiades
- access for public French organisms
- Sentinel-1
- Free access on ESA hub or on CNES PEPS

Basics
Use Monteverdi and QGIS
Description
Summary
The goal is to discover software products and the data package that will be used during the course. You will be able to use both Monteverdi and QGIS to do all exercises of the course.
Prerequisites
- Install Monteverdi and QGIS
- Download data
Goals
Goals of this exercise
- Know how to display an image and set up rendering in Monteverdi,
- Know how to display an image stack in Monteverdi,
- Know how to display an image and set up rendering in QGIS,
- Know how to display vector data in QGIS,
- Know how to display an image stack in QGIS,
- Tips and tricks.
Steps
For this exercise, we propose to work in pairs. At the end of the exercise every team will do a restitution of their experiments to show to other groups some tips they found and ask also some questions about functions available in both software products.
Display an image in Monteverdi
Open the image phr_xs_osr_mipy.tif available in the
Data/preprocessing directory with Monteverdi.
The list of all keyboard shortcuts is available in Help menu.
Change the displayed band and also change the rendering values.
Test effects like Local contrast, Gradient and Spectral angle. What is their purpose?
Change the zoom level by using the mouse wheel, you can edit also the image scale in the bottom in the status bar.
Close Monteverdi.
Display an image stack in Monteverdi
Open the 9 LS8 images in the Data/classification/Extract16bits/
folder.
Change the bands to display natural colors (red: Band 3, green: band 2, blue: band 1). Use the Apply all parameters to all layers button to have the same rendering options on the whole stack.
Use mouse wheel to move between all dates.
Test effects Local transparency, Chess board and Swipe. What is their purpose?
Close Monteverdi.
Display an image in QGIS
Open the first LS8 image in QGIS. Use the contextual menu of the layer to change color dynamics to have the same rendering as in Monteverdi. In the same contextual menu, add this style to be able to apply it to other images.
Move in resolution.
Open other LS8 images and apply the rendering style you’ve just created.
What are the differences between Monteverdi and QGIS in terms of image visualization and rendering functions ?
Display vector data in QGIS
Open training.shp in the Data/classification/training/ folder.
Use the contextual menu to open the Properties and Style tabs. Use Categorised using column LC. How many classes are there in the file? Change the color table to display different classes in different colors.
Open the attribute table. How many polygons are contained in the class pelouse (lawn)?
Try to find how to select and display only polygons from this class.
The Orfeo ToolBox Application mechanism
Description
Summary
During this exercise, we will learn how to use the Orfeo Toolbox applications. Images including messages encoded by steganography are available. You must use the OTB applications to reveal this hidden message for each image.
All images used during this exercise are modified extracts from Pléiades images.
Prerequisites
- Software installed (Monteverdi and Orfeo ToolBox)
- Data downloaded
Objectives
- Know how to look for an application in the list of available applications
- Know how to set application parameters
- Know where the documentation of an application is
- Know how to use several classical applications.
Steps
Data are located in the Data/stegano folder.
For each message, one will first look at the image to try to detect the message, then try to use suggested applications to reveal the message.
Message 1
In image1.tif image, a sentence has been encoded in a high signal
area, using a pixel value which is outside the possible range for
Pléiades (reminder: Pléiades images are encoded with unsigned 12 bits
integers).
Use the BandMath application to detect those out of range values and thus reveal the message.
Message 2
In image2.tif image, a sentence has been encoded within a
homogeneous, low signal area. Modified pixels can not be seen with human
eyes, but could be revealed by computing the image gradient, or some
edge detection.
Use the EdgeExtraction application to reveal the message.
Message 3
In image3.tif image, a sentence has been encoded by slightly
modifying the pixel values in the red and near infra-red bands. This
modification can not be seen with human eyes, but could be revealed by
computing an NDVI radiometric index.
Use the RadiometricIndices application to reveal the message.
You can also use the BandMath application to compute the NDVI index using the following formula:
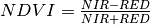
Reminder: For Pléiades images the red band is the first one, and the NIR band is the last one.
Message 4
In image4.tif, a message has been hidden in the 2 least significant
bits of the image. This modification can not be detected by human eyes,
but could be revealed by isolating the values of those 2 bits.
Use the BandMath application to isolate the 2 least significant bits in the image (encoded on 12 bits), to reveal the message.
Note: The rint() function allows to round a floating point value to nearest integer in BandMath application.
Message 5
In image image5.tif, a message has been dissimulated by locally
slightly modifying the image noise. It could be revealed by a transform
that isolates noise.
Use the DimensionalityReduction application to isolate the image noise and reveal the message.
You can also try to figure out other techniques using the applications to highlight this local modification of the image noise.
Message 6
In image6.tif image, a message has been hidden by locally using a
gray-level morphological operation (opening with radius=1). It could be
revealed by using the idempotent property of this transform. A function
 is said idempotent if:
Use the GrayscaleMorphologicalOperation and BandMath applications to reveal the message by using this idempotent property.
Going further
What messages were you able to detect by analyzing the image with Monteverdi? What messages were impossible to detect?
Can you imagine another process to encode hidden messages in images? An
image (image.tif) and a message (message.tif) are provided in
the Data/stegano/diy folder for you to try.
Orfeo ToolBox internals
Description
Summary
This exercise introduces Orfeo the ToolBox pipeline internals.
- Extended filenames,
- Streaming,
- Multi-threading,
- Environment variables,
geomfiles.
Prerequisites
- Installed Monteverdi and Orfeo ToolBox software
- Downloaded data
- Understand Orfeo Toolbox applications (see relevant exercise)
Goal
- Understand OTB’s transparent machinery
- Influence the data processing pipeline
- Know where to find important information
Steps
The data are in Data/internals/ folder.
Encoding images
With Orfeo ToolBox, the user chooses the image encoding type depending on the image. In general we’ll use:
- 8 bits unsigned encoding (with domain [0,255]) for outputs used on screen or paper.
- 16 bits unsigned encoding to represent most satellite images
- 32 bits unsigned encoding to represent intermediate processing steps, computation results with real numbers (e.g. NDVI, radiometric calibration…)
In Orfeo ToolBox applications, the user can choose the image encoding (drop down menu in the GUI interface, or parameter in the command line).
| type | domain | number of bits |
|---|---|---|
| uint8 | [0,255] | 8 bits |
| int16 | [−32 767, +32 767 ] | 16 bits |
| uint16 | [0, 65 535] | 16 bits |
| int32 | [−2 147 483 647, +2 147 483 647] | 32 bits |
| uint32 | [0, 4 294 967 294] | 32 bits |
| float | [ -3.402823 × 10 ,3.402823 × 10 ] ,3.402823 × 10 ] |
32 bits |
| double | [ -10:math:^{text{308}}, 10 ] ] |
64 bits |
Use gdalinfo to know the pixel encoding of image1.tif (you can
also access it from QGIS). Analyse pixel values of the image in
Monteverdi. What can you conclude?
Use the Convert application to convert image1.tif to a 16 bits
integer encoding. Compare both image file sizes. Use the
CompareImages application to compare the content of both images.
What can you conclude? Can you reduce the file size further? (See the
extended filenames paragraph).
Use the RadiometricIndices application to compute an NDVI (Normalized Difference Vegetation Index) from the 16 bits image. Keep the output encoding to 16 bits. Visualize the result. What do you notice? Which encoding should be used to properly store this image?
.geom files
Look into the image1.geom file with a text editor. What seems to be
its purpose? Which processing operations require this type of
information?
Extended filenames
Extended filenames are used to influence the image reading and writing process in Orfeo ToolBox. They are not application specific, but can be used with any Orfeo ToolBox based tool.
The full list of options is listed in the section Extended filename for reader and writer Software Guide. We will illustrate here a few of them.
Read options
Compare the following command outputs:
$ otbcli_ReadImageInfo -in "image1.tif"
$ otbcli_ReadImageInfo -in "image1.tif?&skipgeom=true"
What is the effect of the skipgeom parameter? Note the similar skipcarto which allows to ignore the coarse cartographic projection in the case of Ortho Ready type products (projected onto an average altitude by default).
Compare the following command outputs:
$ otbcli_ReadImageInfo -in "image2.tif"
$ otbcli_ReadImageInfo -in "image2.tif?&geom=image1.geom"
What is the effect of the geom parameter? What can be its purpose?
Write options
Among available write options from extended filenames, the gdal:co
option allows to pass file creation options directly to GDAL. With this
option, and with the Tif file format options available in GDAL,
re-encode image1.tif to signed 12 bits with LZW compression.
Compare file sizes and image contents with the CompareImages application.
Another useful extended filename option is box. Use the box option to write only to a 100x100 pixels square in the center of the image.
Streaming management
By default, Orfeo ToolBox chooses the tiling method most suitable to the
input image, and the block size which maximizes memory usage. Memory
usage is specified to the application, or with the OTB_MAX_RAM_HINT
environment variable. However, it is possible to modify this behavior
with writer extended filenames.
- Use the LocalStatisticsExtraction application to process the
first band of
image1.tifwith a radius of 9. - Execute the above operation a second time, but this time completely disable streaming with the streaming:type extended filename option. What do you notice?
- Execute the above operation a third time, but this time ask for a split of 1000 strips. Use the streaming:type, streaming:sizemode and streaming:sizevalue. What do you notice?
To observe these effects, it is recommended to open a system monitor tool and look at CPU load and I/O throughput.
Multi-threading
By default, every filter in Orfeo ToolBox uses all available processing
cores. This behavior can be altered with the
ITK_GLOBAL_DEFAULT_NUMBER_OF_THREADS environment variable.
Follow the previous example with the LocalStatisticsExtraction application and disable streaming. Use the above environment variable to decrease, and then increase the number of threads. What do you notice?
You can use the time command to measure execution time.
Optical VHR image, from pre-processing to GIS
Preprocessing of Very High Resolution optical imagery
Description
Summary
This exercise allows to get familiar with radiometric and geometric corrections using OTB applications.
Prerequisites
- Basic knowledge of remote sensing imagery
- Basic knowledge on how to use OTB applications
Goal
Know how to perform optical calibration
- Allow to compare and validate values between images and sensors (multi-temp) and multi-sensors
- Convert DN into TOA (Top of Atmosphere) reflectance and TOC (Top of Canopy)
Know how to perform image fusion (pan-sharpening)
- Pan (higher spatial resolution) and XS (higher spectral resolution)
- Test several fusion methods
- Special modes available for PHR Pleiades image fusion (Pléiades mode)
- See effects of image fusion (moving objects, radiometric calibration)
Know how to perform orthorectification
- Spatially locate satellite images
- Associate geographical coordinates to pixel positions
- Know prerequisites; bias, approximations
Steps
Data are located in the Data/preprocessing/ folder. We will also use
the SRTM and Geoid folders.
In this part of the exercise, you will use the phr_xs_osr_mipy.tif
and phr_pan_osr_mipy.tif images. Those are extracts of PAN and XS
from a Pleiades product (Bundle Primary Level 1A) acquired over the
south west of Toulouse.
Atmospheric corrections
The goal is to convert Digital Numbers into reflectances (physical values). The process is composed of 2 steps: computation of Top Of Atmosphere reflectance and then surface reflectance which consists in taking into account atmospheric effects.
[scale=0.18]
(0,0) – +(3,0);
(4,-2) rectangle +(6,4); (SensorModel) at (7,0) DN to Lum;
(11,0) – +(3,0);
(16,-2) rectangle +(6,4); (SensorModel) at (19,0) Lum to Refl;
(23,0) – +(3,0);
(27,-2) rectangle +(6,4); (SensorModel) at (30,0) TOA to TOC;
(34,0) – +(3,0);
(38,-2) rectangle +(6.5,4); (SensorModel) at (41,0) Adjacency;
(45,0) – +(3,0);
With phr_xs_osr_mipy.tif:
- Use the OpticalCalibration application to compute TOA reflectance.
- Use the OpticalCalibration application to compute surface reflectance (TOC, top of canopy).
- Compare both images using Monteverdi or another OTB application (TOA-TOC). Compare the red, green and blue (B0,B1,B2) bands of the TOA and TOC images. Which band is more impacted by atmospheric effects ?
- Apply operations 1, 2 and optionally 3 to the panchromatic image
phr_pan_osr_mipy.tif.
- Use ’-milli’ option which allows to save the output image in integer (16 bits). By default reflectance images are saved as float values (between 0 and 1).
P+XS Fusion
The goal of the exercise is to create a pan-sharpened image from the PAN and XS bundle. Physical constraints on sensor and telescope design do not allow to have at the same time high spatial and spectral resolutions. Indeed, the reduction of the sampling is accompanied by a decrease of the received signal, so the SNR decreases. This is compensated by increasing the diameter of the entrance pupil or by using specific detectors to charge accumulation (TDI) and also varying the width of the spectral band. There is also a constraint on the amount of data that can be archived in the satellite memory. Finally, the bandwidth of the downlink to send the image to the ground is also limited.
As a consequence most VHR sensors deliver 2 types of images:
- Multi-spectral (XS): separate spectral bands each on a spectral range (can overlap). For Pléiades, 4 bands (B,G,R,NIR) with a spatial resolution of 2.8m (resampled to 2m).
- Panchromatic (PAN): grey level image with a detector which covers a larger spectral range (for an improved SNR) which allows to acquire images at 0.7m in the case of Pléiades (resampled to 0.5m).
We will perform pan-sharpening using TOA reflectance PAN and XS images (
phr_pan_osr_mipy_toa.tif and phr_xs_osr_mipy_toa.tif)
- Use the BundleToPerfectSensor application to superimpose and fuse the PAN and XS images. Note that the application has a phr mode (Pléiades) which allows to perform image registration without the need of sensor model parameters (default mode). Indeed, the PHR mode takes advantage of the fact that Pléiades bundle are colocalised on the same grid.
- Which fusion algorithm is used in the BundleToPerfectSensor application?
- (optional) Use applications Superimpose and Pansharpening to perform pan-sharpening with other fusion methods available in OTB.
Orthorectification
This operation allows to associate a ground coordinate (geographical position) to every pixel in the image.
The schema below describes all steps that can be required to go from a set of Level 1 products to a coregistered and colocalized image stack.
[scale=0.2] (-1,-12) rectangle (75,17); in 5,...,1 (,) rectangle +(4,4); (InputSeries) at (4,-1) Input series; (9,5) – +(3,0); (12.2,3) rectangle +(6,4); (SensorModel) at (15,5) Sensor Model; (1,-10) rectangle +(4,4); (DEM) at (5,-11) DEM; (3,-5.5) – ++(0,3) – ++(12,0) – ++(0,5); (18.5,5) – +(3,0); in 5,...,1 (,) rectangle +(4,4); (GeoRefSeries) at (28,-1) Geo-referenced Series;
(25.5,8.5) – +(0,3);
(22,12) rectangle +(8.5,4); (HomPoExtr) at (27,14) Homologous Points;
(21.5,14) – +(-2.5,0);
(11,12) rectangle +(8,4); (BBAdj) at (15.5,14) Bundle-block Adjustement;
(15,11.5) – +(0,-4);
(30,5) – +(3,0); (33.2,2.5) rectangle +(6,4.5); (FineRegistration) at (36,4.9) Fine Registration;
(39.5,5) – +(3,0); in 5,...,1 (,) rectangle +(4,4); (RegistSeries) at (47,-1) Registered Series; (36,2) – ++(0,-10) – ++(-30,0);
(52,5) – +(3,0); (55.2,2.5) rectangle +(6,4.5); (CartoProjection) at (57.5,4.9) Map Projection;
(61.5,5) – +(3,0); in 5,...,1 (,) rectangle +(4,4); (CartoSeries) at (68,-1) Cartographic Series;
These steps can vary depending on the sensor and the product levels.
In the exercise we will only perform image orthorectification of the pan-sharpened product to discover the modes available in OTB.
Use the Orthorectification application to perform the orthorectification:
- Without Digital Elevation Model (DEM)
- With a DEM and a geoid (use the
SRTMdirectory) - Compare the 2 images in Monteverdi. What do you notice?
- What is the projection system by default in the Orthorectification application?
- In which UTM zone is located the Pleiades image?
- Test different projection systems (WGS84, Lambert 93) and open the ortho image in QGIS.
Image segmentation and export to GIS
Description
Summary
This exercise allows to get familiar with large scale segmentation using the MeanShift algorithm. It goes through each step of the procedure and shows how to export and use output segments in a GIS.
Pre-requisites
- Installed software (Monteverdi and QGIS)
- Output data from the VHR image pre-processing exercise
- Know how OTB applications work (see corresponding exercise)
Goals
- Know the steps required to perform a segmentation
- Know how to optimize segmentation parameters
- Know how to export results to a GIS
Steps
Data needed for this exercise can be found in the Data/segmentation
folder.
Image smoothing with the MeanShift algorithm
The MeanShift algorithm performs a smoothing of the image by preserving edges. It produces more homogeneous images and also keeps sharp boundaries between regions. It aims at facilitating the segmentation step done by simple methods like connected component computation. The algorithm performs iterative mean over pixels using a given neighborhood (spatial and spectral).
Compute the smoothing of the image phr_orthopxs_osr_mipy_xt.tif
using the application MeanShiftSmoothing. Change the values of the
ranger and spatialr parameters to see their influence.
Notes:
the modesearch option allows to speedup computation but it is less stable. We will disable it in this exercise.
Spatial (spatialr) and spectral (ranger) radiuses are the most important parameters of the algorithm. The first one corresponds to a number of pixels and the other one corresponds to a distance between pixels in the spectral domain.
foutpos output the spectral mean result for each pixel and will be used in the next questions.
You can use the extended filename parameter box to find the optimal parameters ranger and spatialr without processing all the input image.
In the next step of the exercise we will use ranger around 25 and spatialr around 3 (to limit computation time).
Segmentation
This step allows to produce the initial segmentation using the output images from the smoothing step (fout and foutpos). Adjacent pixels in the fout image for which the spectral distance is lower than ranger and for which the estimated position in foutpos is lower than spatialr will be grouped in the same connected component (segment).
This step is performed on a tile basis. The application allows to set the tile size with parameters tilesizex and tilesizey.
Finally, minsize allows to remove small regions (the threshold corresponds to a number of pixels).
Use the LSMSSegmentation application to perform this step. Some tips regarding the application configuration:
- Use minsize equal to 0 in this first step
- The output image is a labelled image in which each pixel corresponds to an integer value (unique for each segment). It is advisable to encode the output image in uint32 to have enough unique labels. Indeed the segmentation can generate a large number of segments.
- Parameters ranger and spatialr should have smaller values than in the smoothing step. You can start by dividing the value by two.
Use the optimal mode from the ColorMapping application to generate a nice output from the labelled image.
Handle small regions
After the initial segmentation, there is generally lots of small regions which do not correspond to any object or region of interest. The LSMSSegmentation application allows to filter those regions (minsize parameter), but it is also possible to add a post-processing to fuse iterative adjacent regions (using a spectral criteria). This post-processing can be done with LSMSSmallRegionsMerging.
Use this application to re-process the initial segmentation by fusing all regions smaller than 50 pixels.
Use the optimal mode from the ColorMapping application to generate a nice output from the labelled image.
Vectorization
The last step allows to export polygons to a vector file. The LSMSVectorization application performs the vectorization and computes the mean and the variance on each segment using a support image.
Start by computing the NDVI from input image.
Then, use the ConcatenateImages application to stack the input radiometry with the NDVI (be careful with the encoding of the output image).
Use the LSMSVectorization using this image and the segmentation results. You can choose for instance ESRI Shapefile (.shp extension) or sqlite (.sqlite extension) as the vector data format (all formats supported by GDAL/OGR can be used here).
Open the input image and the vector layer in QGIS. Adapt the vector rendering to display polygon edges in red and the interior ring with 100% transparency. Analyze the segmentation and comment the result.
Open and comment the attribute table.
Filter segments in QGIS
Use the selection tool in QGIS using SQL expressions and the layer attributes table to select polygons which do not correspond to shadow areas and copy them in another layer.
Use the calculator on attributes to create a new column which will store polygon’s compacity:
Use the attribute selector interface to select compact polygons with a high NDVI value (trees?). Copy the result to a new layer in QGIS.
Supervised classification of a satellite image time series
Description
Summary
This exercise allows to get familiar with supervised, pixel-wise classification applications in Orfeo ToolBox, using a Sentinel-2 time series and a reference dataset for supervision.
Pre-requisites
- Software installed (Monteverdi and Orfeo ToolBox)
- Data downloaded
- Basic knowledge on using applications in OTB
- Basic knowledge on supervised classification
Objectives
Objectives are the following:
- Knowing the different applications of the supervised classification process
- Using different learning algorithms
- Measuring classification performances
- Post-processing of classification
Steps
Data are available in the Data/classification folder, with following
sub-folders:
imagescontains the Sentinel-2 time series,references/trainingcontains training data in shp format,references/testingcontains testing data in shp format
Introduction to Sentinel-2 data
In the data package, folder Data/classification/images contains 5
Sentinel-2 images, extracted on tile T31TCJ, at the following dates:
| 2016-06-07 |
| 2016-07-07 |
| 2016-08-06 |
| 2016-09-05 |
| 2016-10-05 |
Those images are multispectral, with 10 bands resampled at 20 m:
| # | Band name | S2 band id | Wavelength | Initial resolution |
|---|---|---|---|---|
| 0 | Blue | B2 | 490 nm | 10 m |
| 1 | Green | B3 | 560 nm | 10 m |
| 2 | Red | B4 | 665 nm | 10 m |
| 3 | NIR - Narrow 1 | B5 | 705 nm | 20 m |
| 4 | NIR - Narrow 2 | B6 | 740 nm | 20 m |
| 5 | NIR - Narrow 3 | B7 | 783 nm | 20 m |
| 6 | NIR - Wide | B8 | 842 nm | 10 m |
| 7 | NIR - Narrow 4 | B8A | 865 nm | 20 m |
| 8 | SWIR 1 | B11 | 1610 nm | 20 m |
| 9 | SWIR 2 | B12 | 2190 nm | 20 m |
We therefore have 50 bands for each pixels. Images are encoded over 16 bits.
Open one image in monteverdi and set the bands for a true color display (red, green, blue)
Open the remaining four images and look for changes.
Note: The QGIS style file support/images.qml can be loaded into
QGIS to set the rendering and color channels for each image.
Files references/training/training.shp and
references/testing/testing.shp contain polygons defining 13 classes
over the scene:
| Code | Name | #polygons training | #polygons testing |
|---|---|---|---|
| 10 | Annual crops | 3129 | 3078 |
| 31 | Deciduous Forests | 176 | 292 |
| 32 | Evergreen Forests | 23 | 29 |
| 34 | Grass | 2 | 2 |
| 36 | Woody Moorlands | 63 | 38 |
| 41 | Dense Urban Area | 30 | 33 |
| 42 | Light Urban Area | 326 | 239 |
| 43 | Industrial Area | 154 | 212 |
| 44 | Roads | 162 | 114 |
| 51 | Water | 243 | 332 |
| 211 | Meadow | 320 | 311 |
| 221 | Orchards | 227 | 254 |
| 222 | Vineyards | 129 | 97 |
Open one of the files in QGIS. The attribute table can be accessed by right-clicking on the layer -> Open attributes table. Each label is visible, and the list can be filtered with SQL expressions.
Note : There is a style file support/polygons.qml that can be
loaded into QGIS to colorize polygons according to their classes.
Polygons are split into two sets: training and validation.
Single date training
We are going to use the TrainImagesClassifier application in order
to do supervised learning from the training date in
references/training/training.shp. First, we are going to work with
the image from the 07.06.2016.
The TrainImagesClassifier application will sample some image pixels within the training polygons, in order to build a well-balanced training set. This set is then passed to the learning algorithm.
This application has some mandatory parameters:
- The input images, which bands will be used as features by the learning algorithm,
- The vector layer containing references polygons,
- The name of the field in that layer that contains the class identifier,
- The output file containing the learning model (call it
model.rf).
Some optional parameters should also be set as follows:
- Random forest classifier for the learning algorithm,
- The number of tree set to 50,
- The maximal tree depth to 20,
- The minimum number of samples in each node to 70,
- The number of clusters to 13 (equal to the number of classes)
Look at the application logs, in particular the confusion matrix, the Kappa coefficients, and scores per class. What do you think of those results ? Without using polygons dedicated to validation, the application will use a part of the generated samples for validation. What can be deduced regarding the displayed performances ?
Do the training again, but this time also use the validation dataset in
reference/testing/testing.shp as validation layer (you therefore set
two different shp files in the application). What can be observed ?
Do the training again, and deactivate the cleanup option. Look at
the intermediate data that have been generated. What are they used for ?
Spot the date with the best performance
Do the training again, this time for each image date. What is the date with the best performances ? Does the Kappa coefficient change a lot ?
Keep the model.rf file corresponding to the best date.
Classifying and producing a colored classification map
Use the ImageClassifier application to produce the classification map corresponding to the best date (the one from 05.09.2016). Be careful to use the model file training with this date.
The output map is a TIFF image where each pixel value corresponds to the class. To visualize such images, the ColorMapping application allows to set a given color for each class.
Use the custom mode from the ColorMapping application with the
look-up table in support/color_map.txt to produced the colored map.
Note : The image may not display correctly in QGIS, because of default no data value set in the file. No data can be deactivated in QGIS layer properties dialog.
Evaluate global performance
We are now going to use the ComputeConfusionMatrix application in order to compute global classification performances. With respect to the performance evaluation during the training step, this application allows to:
- Take into account all pixels in the reference date,
- Evaluate performances of a post-processed classification map (for instance with regularization).
The ref.vector.field CODE parameter is mandatory to indicate the
field corresponding to class ids.
Compute the global performance of the classification. What do you observe with respect to the performance computed during training ? How to explain this phenomena ?
Classification regularization
We are now going to use the ClassificationMapRegularization application. It filters the classification map using a local majority voting scheme.
Parameters are:$
- ip.radius 1
- Radius of the voting zone
- ip.suvbool 0
- What to do in case of tie vote. 0 is to keep the initial value.
Filter the result of previous classification. Evaluate the performances of the filtered map. What do you observe ?
Classification with multiple dates
We are now going to use all dates for classifications. For this, you can
use the images/all.vrt which contains all bands from each date
concatenated (the image has therefore 50 bands).
Do the whole workshop, but this time with this 50 bands image. What do temporal series bring to the performance of classification ?
Compare both results in QGIS.
Going further
- Can we obtain better performances with other classification algorithms ?
- In QGIS, merge in reference data the grass and Woody Moorlands. Are the performances better ?
- The
TrainImagesClassifieralso has an unsupervised algorithm (Shark KMeans). Compare results with supervised and unsupervised classification.
SAR processing on Sentinel-1 images
Introduction to SAR image processing
Description
Summary
The following exercise is an introduction to processing and analysis of SAR images using the ORFEO ToolBox.
There are also a lot of other open source tools to process SAR images that can be used in combination with OTB (see PolSARPro, Sentinel-1 toolbox…)
Prerequisites
- Installed Monteverdi and Orfeo ToolBox software
- Downloaded data
- Understandig of Orfeo Toolbox applications (see relevant exercise)
Goals
- SAR image manipulation
- Radiometric calibration
- Geometric corrections
- Speckle filtering
- Basic SAR polarimetry
Steps
Data located in Data/sar folder.
Introduction to SAR imagery
In this exercise we will use an extract from a Sentinel-1 SLC Strip Map
(80 km Swath, 5 x 5 m spatial resolution): s1_hh.tif et
s1_hv.tif. The image is located in Germany near the Constance lake
(47.456276, 9.638616).
- Open the image in Monteverdi. How many bands are present in each image?
- What do these bands correspond to in the complex product?
- Compute the image intensity of the complex products
s1_hh.tifands1_hv.tif. Compute also the image intensity in decibels (dB).
Radiometric calibration
SAR images, like this Sentinel-1 product, provide pixel values without units (radar reflectivity or radar brightness). These are called digital numbers (DN).
Image metadata allows to transform DN into physical values (in case of SAR backscattering coefficient) which allows to compare images from different sensors or acquired at different dates in order to perform analysis.
SAR calibration consists in computing one of the following physical magnitudes:
 : radar brightness coefficient, the reflectivity per
unit area in slant range which is dimensionless.
: radar brightness coefficient, the reflectivity per
unit area in slant range which is dimensionless. : radar backscatter (ratio of the outgoing radar
signal that the target redirects back towards the antenna).
: radar backscatter (ratio of the outgoing radar
signal that the target redirects back towards the antenna). : backscatter normalized by the incidence angle.
For Sentinel-1, Look Up Tables available in image metadata allow to convert DN into those values. ORFEO ToolBox will retrieve these values automatically and compute the backscattering coeficient.
- Find the application which allows to perform this operation with OTB
- Compute for HH and HV images.
- Convert in decibels (dB).
Geometry corrections
We will use here the output of the radiometric calibration exercise
( ) as input.
Use the Orthorectification application to perform geometric corrections using S1 metadata from the SLC product:
- Without Digital Elevation Model (DEM)
- With a DEM and a geoid (use the
SRTMfolder) - Compare the 2 images in Monteverdi.
Speckle filtering
SAR images are affected by speckle noise that inherently exists in and which degrades the image quality. It is caused by the coherent nature of backscattered waves from multiple distributed targets. It is locally strong and it increases the mean grey level of a local area.
Several different methods are used to eliminate speckle noise, based upon different mathematical models of the phenomenon. In the following part we will use the Frost filter. This algorithm has 2 parameters:
- Radius: window radius
- deramp: controls the exponential function used to weight effect of the distance between the central pixel and its neighborhood.
You can find more details about the Frost filter here.
- What despeckle methods are available in OTB?
- Use the Frost filter with different radiuses (3, 5 and 10) and comment about the effects on the output image.
- Compare the histogram of the filtered image with the one of the intensity?
- Use the Frost filter with
radius=5and different deramp values (00.5, 0.2 and 0.8). Comment about the effects of the deramp parameter.
Polarimetry
We will introduce basic notions of SAR polarimetry to show that HH and HV polarizations allows to access different types of information.
- Compute the difference between HH and HV (use the intensity images as input).
- Create a color composite of bands HH, HV and HH-HV. We can take here 2*HV as HV backscattered values are generally lower.
- Convert the color composition into decibels (dB).
- Display the image in Monteverdi and comment about the differences between HH and HV (layover areas, vegetation, soil, water…)
- Using the image which combines HH, HV and HH-HV in decibels try to
find in the extract:
- the coordinates of 2 parallel power lines;
- harder to find, locate in the image an area which looks like a corner reflector (reflects waves back directly towards the source);
- what can you see in the lake at pixel coordinates (930,1170)?
Feature extraction
To go further, we can explore available feature extractions methods for SAR available in OTB.
See for instance Touzi filter in EdgeExtraction application.